

Gross margins and selected profit metrics for Coach, Pop Mart, lululemon, Miniso, Five Below, TJX and Costco, plus where each books its occupancy costs.
The Malls.com editorial team reviewed top-growing retailers and found insights in their financial reports that help us compare margins and identify a few meaningful trends. We created a much more comprehensive table because margin tables for retailers usually stop at the number. This one adds the column that decides what the number means: whether occupancy costs sit inside gross margin or below it.
Reported margins are not fully comparable across retailers. The table shows both the figure and the accounting treatment behind it, from the latest filings as of August 2026.
| Retailer | Gross margin | Secondary profit metric | Period | Occupancy inside gross margin? | Source |
|---|---|---|---|---|---|
| Coach (Tapestry) | 79.7% | 35.8% adj. operating | FY26, ended Jun 27 | No (SG&A) | 10-K |
| Pop Mart | 69.7% | 30.0% adj. net | H1 2026 | No (distribution and selling) | Interim results |
| lululemon | 54.2% | 11.2% operating | Q1 FY26 | Yes (cost of sales) | 10-Q |
| Miniso | 43.3% | 13.3% adj. operating | Mar quarter 2026 | No for directly operated stores* | IR release |
| Five Below | 37.2% | 12.0% operating | Q1 FY26, ended May 2 | Yes (COGS, incl. rent, CAM, utilities, property taxes) | 10-Q |
| TJX | 31.4% adjusted | 11.9% adj. pretax | Q2 FY27 | Yes (cost of sales, incl. buying and occupancy) | IR release |
| Costco | 11.04% (company-defined) | ~4% operating | Q3 FY26 | No | 10-Q |
*Most of MINISO Group’s stores were partner- or distributor-operated at the end of 2025, so the corporate margin is not a clean proxy for the rent economics of an individual store. Figures from company filings as of August 2026; margin compilation and occupancy-accounting mapping by Malls.com.
Three caveats matter before comparing the rows. The secondary profit column mixes metrics on purpose, because companies disclose different ones; each row is labeled and they should not be read as one comparable series. Miniso’s GAAP operating margin of 26.7% for the March quarter includes an unrealized investment gain of RMB 874.6 million; the adjusted 13.3% is shown. TJX’s reported gross margin of 33.4% for the July quarter includes a tariff-refund benefit; the adjusted 31.4% is shown. Dick’s Sporting Goods is omitted because its consolidated figures now include Foot Locker; the standalone Dick’s business ran a 36.34% gross margin, with occupancy booked in cost of goods sold.
The rows show two patterns. The high end of this sample is dominated by retailers with greater control over product, IP and pricing. Consumer price tier alone explains little. And the lowest figure belongs to one of the strongest models in the set: Costco defines its merchandise margin at 11.04% while collecting $1.37 billion of membership fees in a quarter with $2.82 billion of operating income.
For leasing professionals, the fifth column is important; it prevents the wrong comparison. lululemon’s 54.2, Five Below’s 37.2 and TJX’s 31.4 already have occupancy taken out; Coach’s 79.7 does not. Before comparing tenants on margin, check where each one books the rent.
Store-level productivity, occupancy-cost ratios and post-rent cash generation remain the numbers landlords actually underwrite on, and public filings rarely disclose them. This table is a public screening tool, to be read alongside store productivity and occupancy-cost data where those figures are available.
Tenant rosters, anchors and opening pipelines for 7,000+ malls are tracked in the Malls.com databases. Weekly expansion signals land in Malls Money.
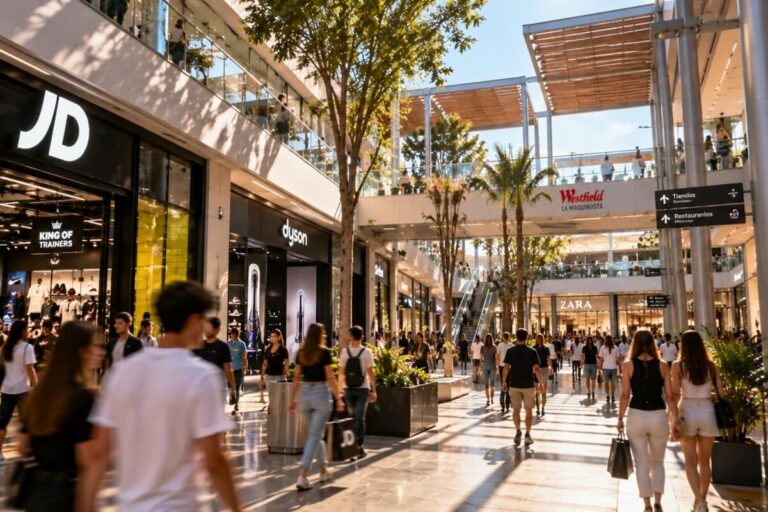
The vendors and deployments behind shopping advice, store navigation and retail operations, with a closer look at what it takes…
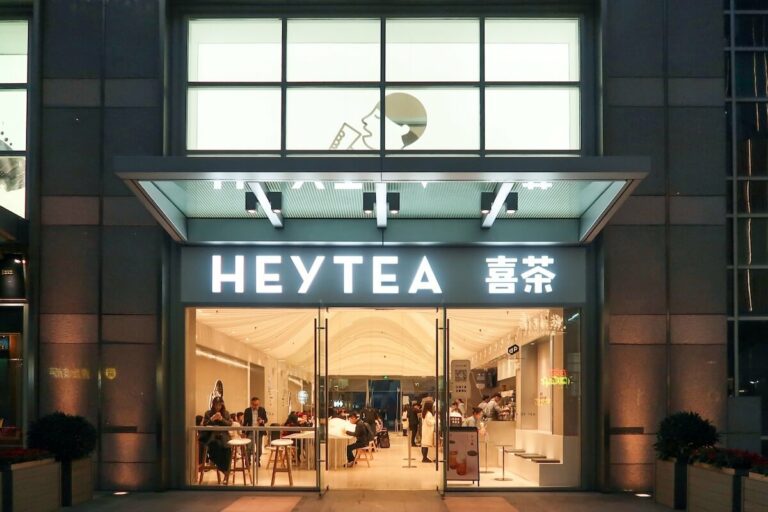
Miss A, Rowan and HEYTEA are on US mall opening lists in fall 2026. Their public records show what each…
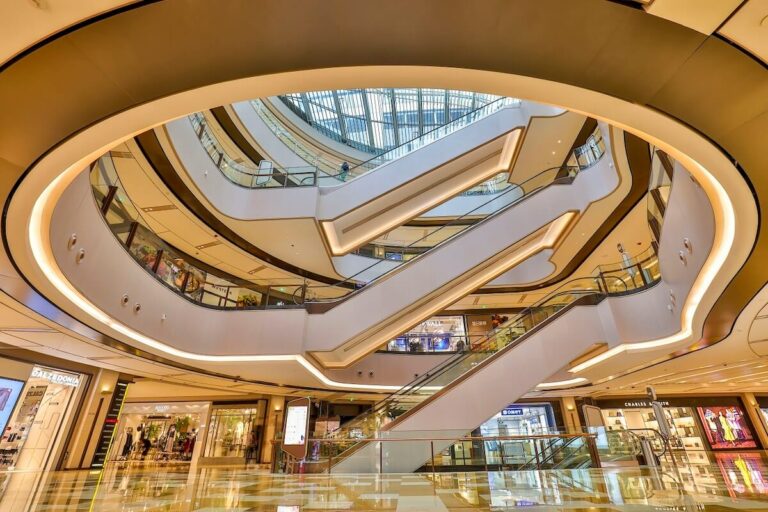
NikeSKIMS, Birkenstock and Starbucks Reserve chose HKRI Taikoo Hui for major China debuts. Why the Shanghai complex keeps winning new…
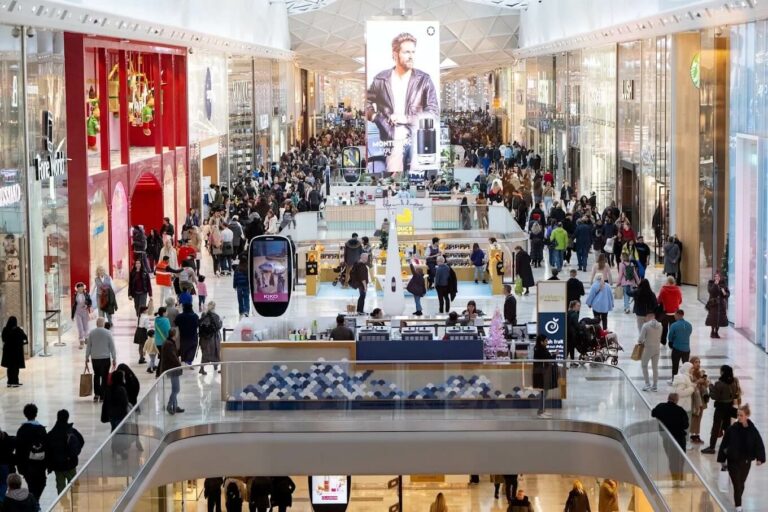
Bluewater opens its first new anchor since 1999. Next takes the former House of Fraser space with about 132,000 square…

Opening in IMAX 70mm on July 17, 2026: Christopher Nolan's The Odyssey. Select shows went on sale one year in…

European retail is scaling AI, agentic commerce and retail media, but consumer trust is becoming the constraint. Four structural shifts…
